This blog post covers that what are the ways that we can extract the DAX query from a visual or from a selected columns and tables with filters.
This will be more useful for who are working on below scenarios or use cases.
- Build a testing or data validation framework for Power BI semantic model and reports – As part of the data validation, you need to get the data from each visual and compare against your underlying data source data. To achieve this you need to get the DAX query used on each visual.
- Build a customized alerting system based on the data points with selected attributes and measures or from a selected visual. If the value is changing based on the threshold then you can send an alert. To achieve this we can use Power Automate or any applications where you can call the APIs to execute the DAX queries. As part of Microsoft Fabric, we have data activator which can help you to get the alerting from your visuals. If you have more customization scenarios then you may need to construct a your own one.
There could be other scenarios also, but the above ones are the primary use cases where you may need to get the DAX query out from visuals.
DAX query can be generated in multiple ways. Explained all the different ways below.
Method 1 – Power BI Desktop
This is the most recommended and easiest way to get the DAX query from any visual even with different filters and conditions.
Build a visual with whatever dimensions and measures that you need. Apply slicers or filters on the page or visuals. You can also consider your existing report where you have visuals. Use the Performance Analyzer to capture the DAX script.
Follow the below steps,
- Open your PBIX file in Power BI Desktop
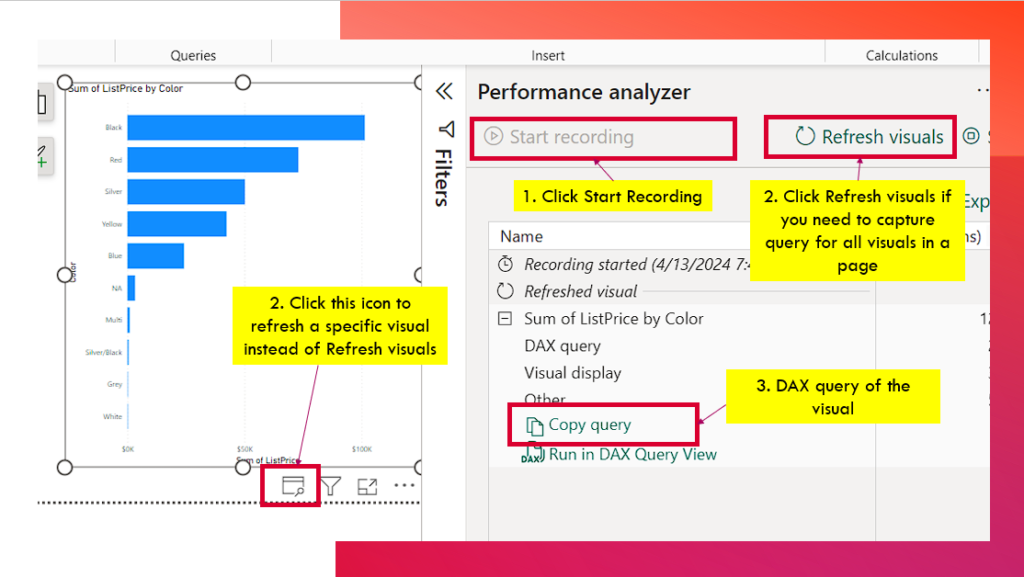
- Go to Optimize tab and choose Performance analyzer
- Start recording and click refresh visuals or refresh a specific visual
- You will get a visual time for each object and when you expand then you will get a copy query object if that visual or object supports data elements and generate DAX query.
Method 2 – Power BI Service
In this method, you can get the DAX query but you will not have control over on taking columns from different tables and applying filters etc.
Let’s say that you need to generate a DAX query from a specific table on your semantic model then you can simply select the table and choose the columns that you want to consider.
- Go to Power BI workspace where you have your semantic model is available
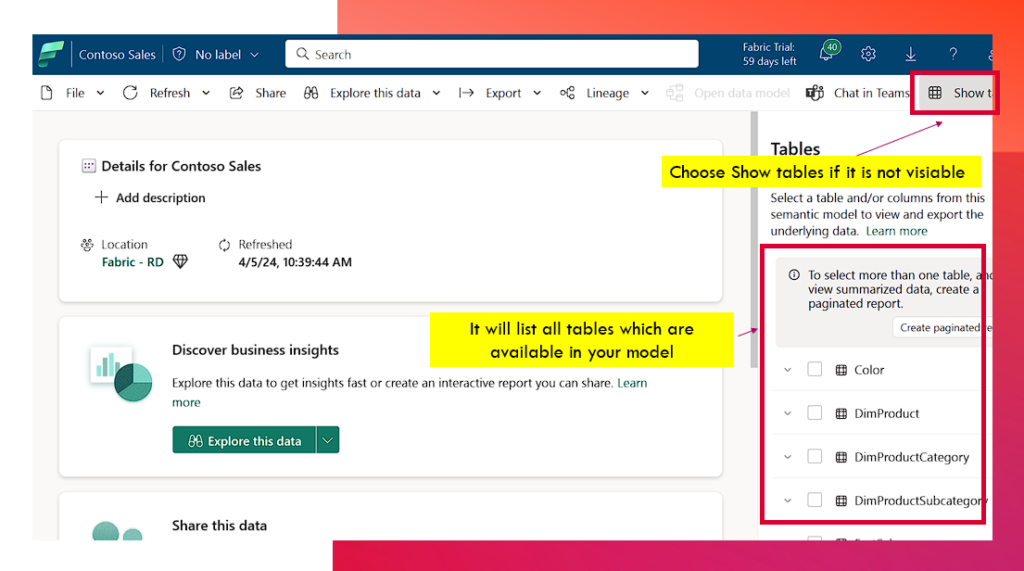
- Choose your semantic model and you will see a window like below.
- Select show tables and it will list all the tables which are available on your semantic models.
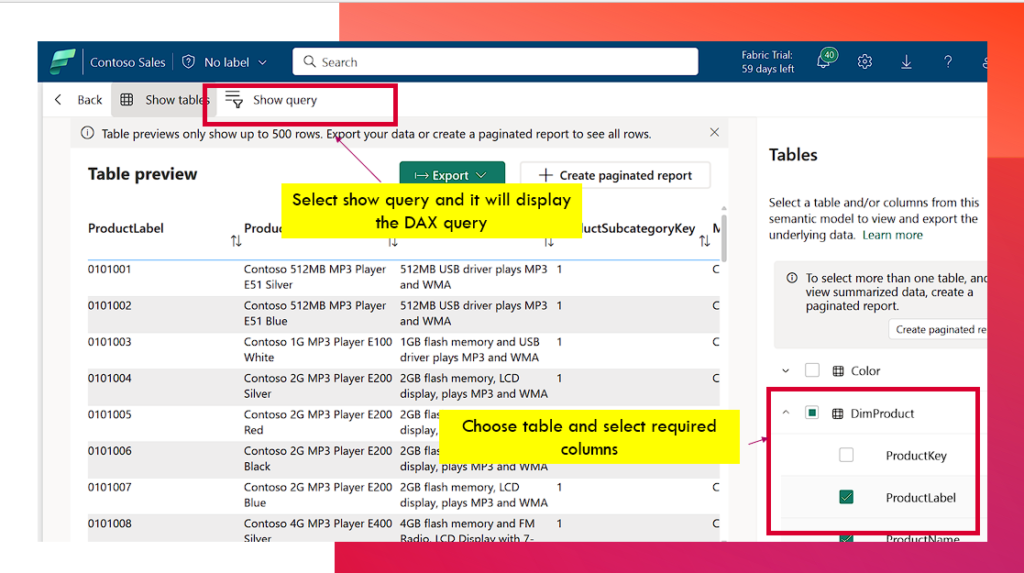
- Choose any of the table and you still can choose a specific columns from the table. But you can’t choose multiple tables in this view.
- On the table view, you can see a show query option. That will show the DAX query of the table you selected.
Method 3 – Power BI Report Builder
Using Power BI repot builder, we can build a query with whatever dimensions and measures we want by leveraging the drag and drop option on the query builder.
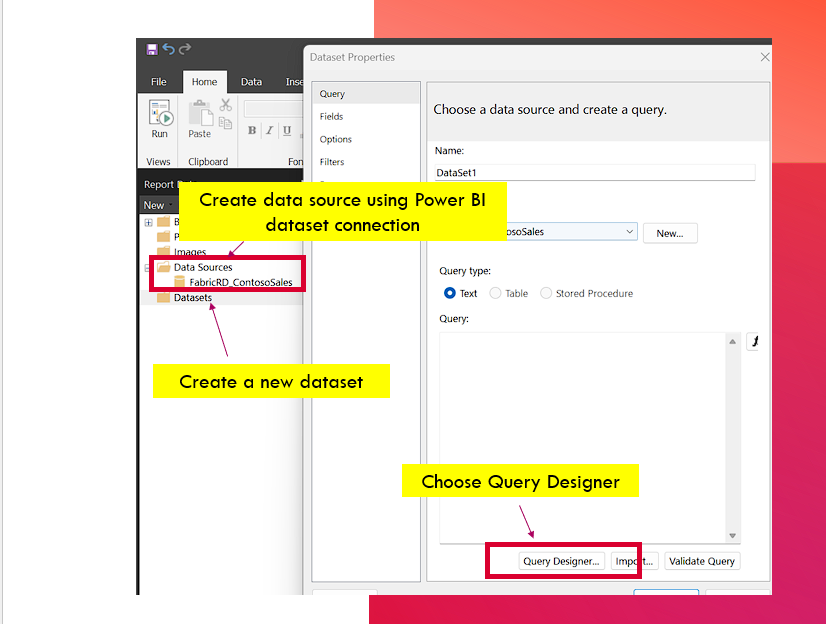
- Open Power BI report builder application
- Create a data source by choosing the “Add Power BI Dataset Connection”. Choose your semantic model from your workspace.
- Create a new dataset using the selected data source. Click Query Designer
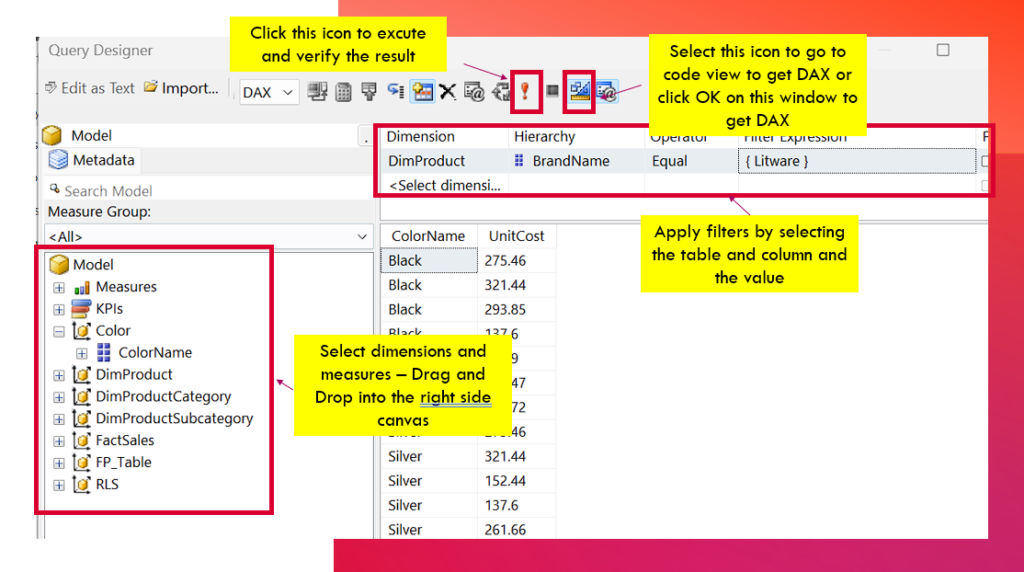
- Drag and drop of the dimension and measures. Also if you need to filter some values then use the above section.
Method 4 – SQL Server Management Studio
We can use SQL Server Management Studio (SSMS) to connect to the semantic model or dataset using the Analysis Service option. In this method, you need to use the XMLA endpoint of your workspace (need premium workspace).
- Go to your Power BI workspace
- Get the workspace connection (XMLA endpoint) by going to the workspace settings and Premium and at the bottom of the page, get the workspace connection.
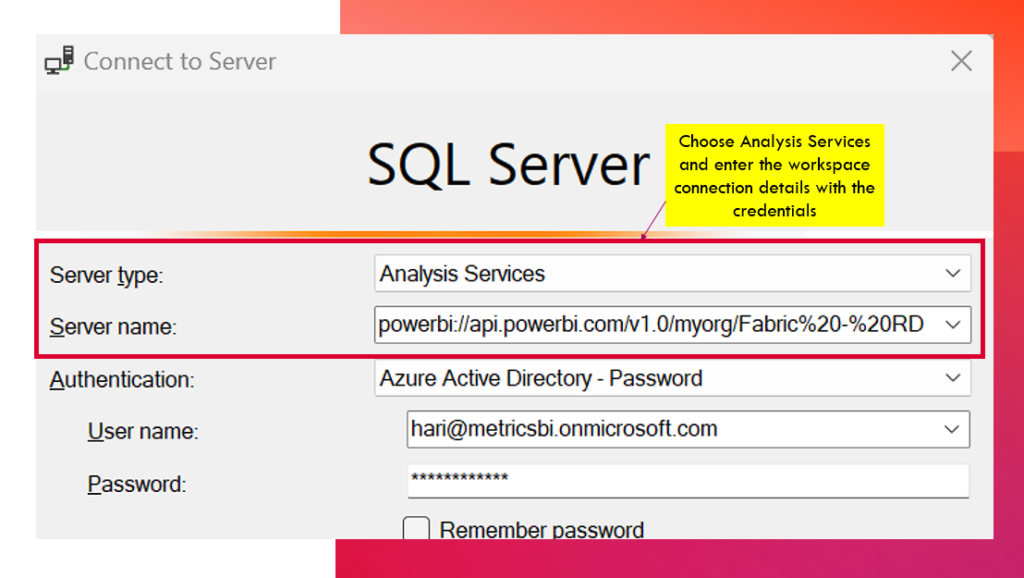
- Open SSMS and choose “Analysis Services” as value on Server type and pass the workspace connection details under server name and provide the credentials.
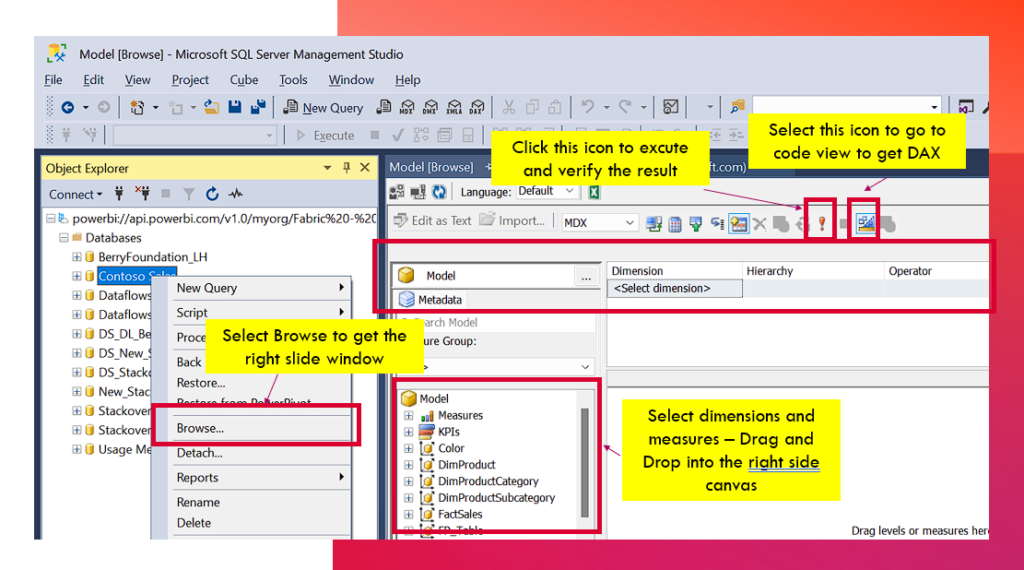
- Expand the Databases folder and select your semantic model and right click and choose “Browse”
- It will show a window where you can drag and drop the dimension and measures. The experience is same as that you see on Power BI Report Builder Query Designer window.
There is one more option using SSMS, that is using SQL Server profiler. Using the profiler, you can connect to analysis services and capture the traces. The traces will be captured for the entire report, you need to run the report on the workspace to generate the traces.
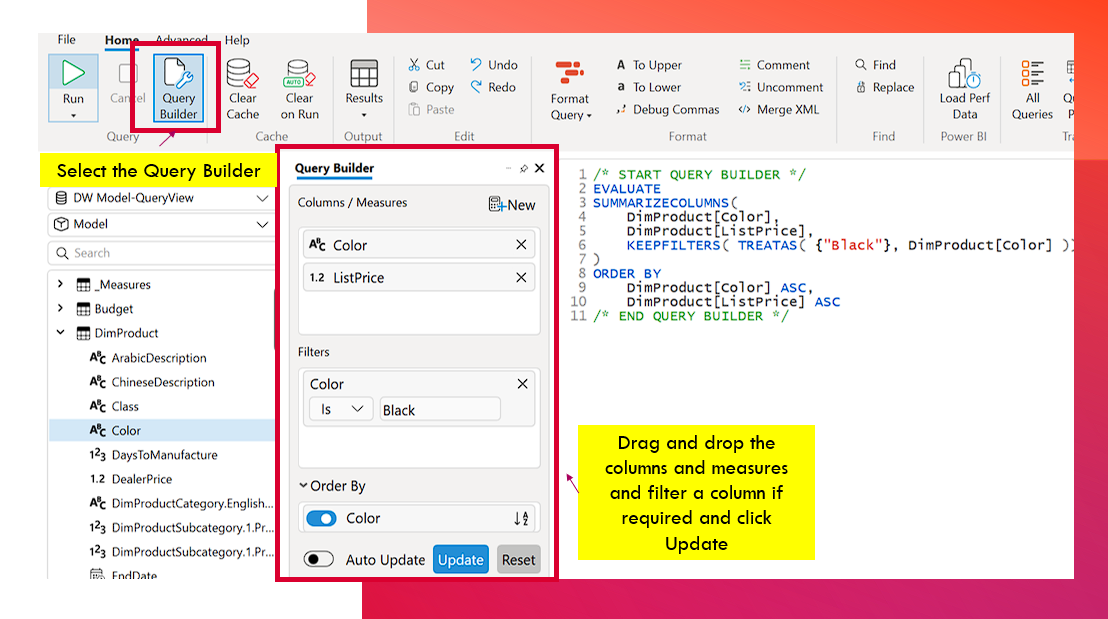
Method 5 – DAX Studio
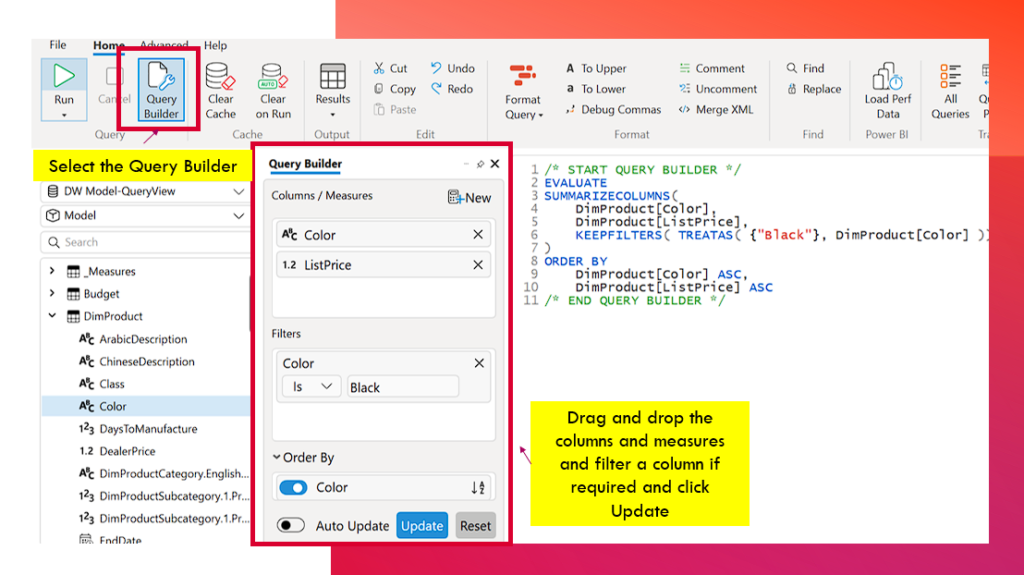
DAX Studio has a very interesting feature called “Query Builder. Using query builder we can select the required columns and can apply filter and generate the DAX script
- Open DAX studio – connect to your local Power BI Desktop model or use tabular model using the workspace connection.
- Select “Query Builder” and drag and drop the columns and measures. Once you click update, it will generate the DAX script.
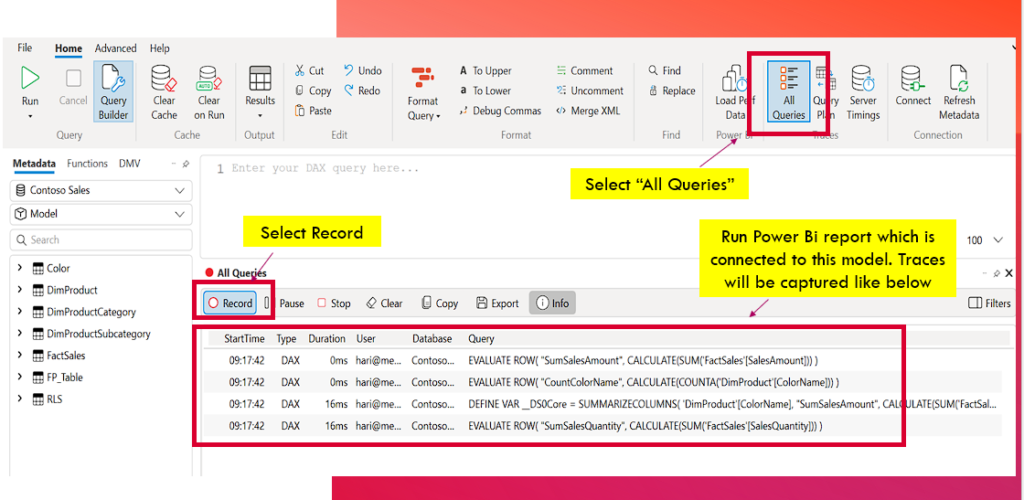
DAX studio also has an option called All queries. Using this option, we can capture all the queries that are running against the semantic model. Run a report where you have visual and you will see the queries like below.
Conclusion
There are still few more methods to get the DAX queries using different services and tools. Example Log Analytics. If you use Log Analytics for your Power BI workspace then it will capture all the log/queries that are triggered from the reports. Those queries will have the DAX query.
I hope this article helpful to you to understand different methods to get the DAX query. If you use any other method to get the DAX query then let me know in the comments. It will be helpful to others as well.
Happy Learning!
Leave a Reply